

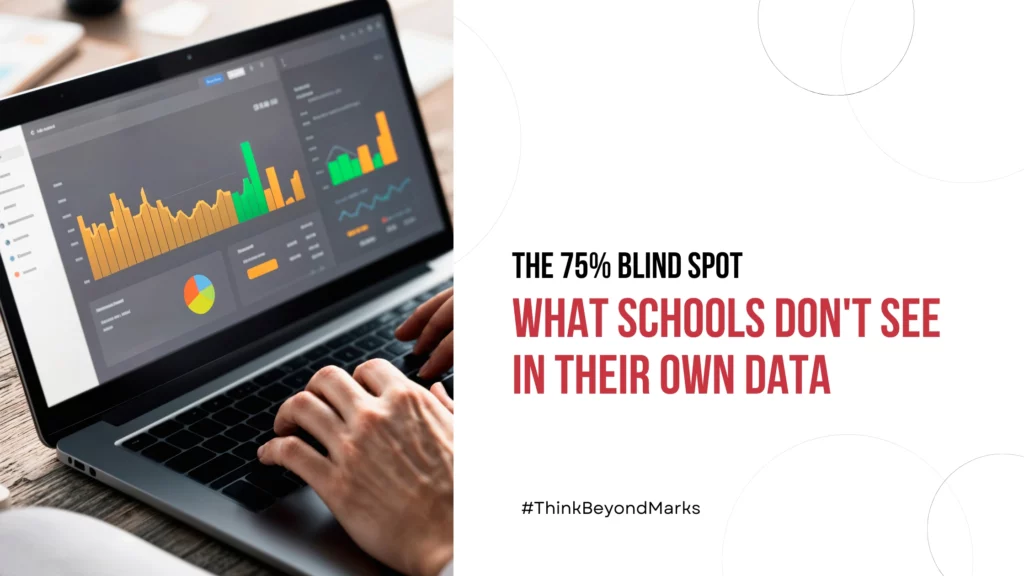
Every single day, administrative servers overflow with operational data from morning attendance logs to digital learning portal clicks. Yet, most institutions track only 25% of their total operations, leaving this valuable goldmine as unused digital noise. Relying strictly on end-of-term examination marks provides an incomplete picture of campus health, failing to reveal why classrooms succeed or struggle.
By shifting to proactive data analytics for schools, administrators and teachers can connect scattered operational data into real-time, actionable insights. Moving beyond static grade logs helps educators evaluate engagement, identify operational gaps early, and intervene before problems escalate.
Network Reports
Modern classrooms depend heavily on digital infrastructure. Even the best data-driven teaching methods collapse if digital learning tools, interactive displays, or online portals suffer from technical downtime. Network infrastructure reporting maintains campus-wide operational stability by providing clear visibility into Wi-Fi uptime and technical bottlenecks.
- Check campus Wi-Fi uptime and dead zones: Monitor signal strength and access point traffic across all blocks to eliminate dead zones
- Ensure uninterrupted digital learning: Prevent sudden drops in connectivity during interactive sessions, live online lessons, and digital assessments
- Prevent tech glitches during classes: Identify bandwidth bottlenecks during peak hours before they cause delays in live lectures or online testing portals
Device Reports
As schools issue laptops, tablets, and interactive classroom displays, keeping track of physical and digital asset utilization becomes critical for IT administrators. Dedicated data analytics reports allow administrators to maintain complete control over hardware lifecycles and student device safety.
- Track active laptop and tablet usage: Hardware usage logs provide clarity on overall asset health, battery performance, and active usage rates across all grade levels
- See apps and websites students access: Monitor software applications and web domains accessed during school hours to evaluate tool adoption, safety, and student focus
- Set smart usage and restriction policies: Implement data-driven content filtering, app restrictions, and balanced screen-time guidelines across all school-owned devices
Performance Analytics Matrix
| Metric & Report | What It Tracks | Actionable Pedagogical Shift | Comparative Metric (Analytics) |
| Topic Master Log | Concept-wise score breakdown per chapter | Switch from lecture format to peer tutoring or gamified modules for weak topics | Compare Report 1 (Pre-Intervention) vs. Report 2 (Post-Intervention) |
| Assignment Velocity | Time taken to submit vs. accuracy rate | Identify students guessing quickly versus those spending excessive time stuck | Benchmark individual speed against class average completion curve |
| Retention Index | Re-test scores on core topics after 30 days | Implement spaced-repetition warmups during morning homeroom periods | Track long-term knowledge retention across terms |
Academic & ERP Reports
Standard report cards aggregate marks into broad subject grades like “72% in Science,” masking diagnostic details. By leveraging continuous data metrics inside ERP systems, schools can transition from static grading to diagnostic academic management.
- Monitor attendance trends continuously: Treat attendance as a health indicator, triggering automated parent alerts and flipped-classroom support during consecutive absences.
- Track student progress over time: Evaluate continuous learning curves across terms rather than relying solely on high-stakes final examinations
- Spot academic drop-offs long before exams: Identify early learning friction, concept drop-offs, and assignment delays early enough to launch targeted interventions before grades fall
Complete School Analytics Tracking Framework
| Report Category | Key Data Metrics Tracked | Administrative & Teaching Insight | Target Outcome |
| Attendance Analytics | Classroom absence frequency, day-wise trends, lecture dropouts | Triggers parent outreach; enables flipped classroom resources & hybrid lecture planning | Prevents chronic absenteeism and learning gaps |
| Academic Diagnostics | Topic mastery, error patterns, assignment submission speed | Allows teachers to adapt instruction methods and compare pre/post intervention reports | Replaces rote scoring with targeted conceptual mastery |
| Engagement & Retention | In-class poll responses, active portal participation, re-quiz scores | Measures real-time absorption during class sessions rather than end-of-term memory | Fosters interactive, student-centered classroom environments |
| IT Infrastructure | Device health, bandwidth usage, LMS uptime, connectivity drops | Helps IT administrators ensure digital tools run smoothly without disruption | Guarantees seamless access to educational technology |
Engagement Reports
Scores measure output; engagement measures process. Implementing targeted data analytics for schools allows academic leads to evaluate active classroom absorption in real time.
- Measure real-time classroom participation: Utilize quick digital polls, mid-class formative checks, and interactive whiteboards to gauge student attention
- See if students absorb what is taught: Track diagnostic response accuracy during live sessions to confirm whether concepts landed before moving forward
- Spot disengagement before grades drop: Flag slipping participation rates, low portal interaction, and submission delays early to prevent burnout or chronic learning gaps
Data Protocols Across School Departments
Establishing holistic data analytics for schools requires active collaboration between administrative leadership, IT leads, and teaching staff. Standard operational protocols ensure data translates directly into weekly institutional improvements:
- Weekly Operational & Academic Huddles: Department heads review IT uptime logs, device usage rates, and topic master logs to reallocate instructional time
- Administrative Intervention Triggers: Principals and coordinators set threshold alerts to initiate rapid cross-departmental support
Building a Complete School Ecosystem
Transforming raw operational data into actionable intelligence does not require an overwhelming technical setup. Implementing comprehensive data analytics for schools unlocks full visibility across IT infrastructure, device usage, diagnostics, and student engagement.
Grades are just one data point. Encouraging leaders to #ThinkBeyondMarks helps schools see the complete picture, creating high-performing environments where operations and academics thrive.


 1st Floor, H-31, Sector 63,
 +91 7898375456